

Building an Operations Infrastructure from Scratch
Custom-built Airtable maintenance system that transformed chaotic 3D printer operations into a scalable, data-driven reliability framework.
-
Strategy
Operations & Systems Development
-
Client
KAV
-
Tags
Background
When I stepped into KAV’s manufacturing environment, the print operations were overwhelmed.
There was no centralized system for tracking printer issues. No structured failure logging. No consistent categorization. No analytics. No historical trend visibility.
KAV’s production relied heavily on 3D printer farms. As output scaled, failures increased; but without structured data, patterns were invisible.
KAV’s additive manufacturing operations were being throttled by an invisible enemy: unstructured failure. Printers were going down constantly; clogs, calibration drift, mechanical faults, temperature errors; yet the business had no durable way to understand the pattern of those failures or measure their impact on production throughput.
Technicians were overwhelmed. Production output was inconsistent. Management couldn’t confidently answer simple questions like:
Which printers are repeat offenders?
What failure types are trending upward?
How long do repairs actually take?
Is downtime improving or getting worse over time?
Where are our training gaps causing delays?
The core issue was not “printer maintenance.”
It was the absence of an operational system capable of producing reliable, analyzable data and converting that data into automated action.
So I built the missing layer: an internal maintenance platform designed to function like an operations product, not a spreadsheet.
What I Built
Airtable became the backbone of a full maintenance ecosystem spanning two factories (Redwood City and Buffalo), with:
QR-based ticket intake at the printer rack
Structured issue taxonomy + validation
Daily automated scheduling + assignment
Certification-gated routing
Priority escalation + backlog control
End-of-day resets to prevent stale ownership
Slack as the operational control plane
Technician performance dashboards
Fleet management + serial-number reliability history
Audit logs and admin governance
Factory/timezone segmentation for multi-site scale
This system didn’t just “track tickets.”
It closed the operational loop: intake → routing → execution → measurement → training → optimization.
Designing a Self-Managing Maintenance Workflow
The core of the KAV Maintenance System was not ticket tracking; it was workflow automation. The objective was to eliminate manual dispatch, prevent backlog stagnation, and enforce operational discipline without adding managerial overhead.
Rather than relying on reactive coordination, the system was engineered to evaluate workload, technician capability, and ticket urgency automatically every day.
The automation layer transformed maintenance from a reactive process into a controlled operational loop:
Intake → Evaluation → Assignment → Escalation → Rebalancing → Reporting
Every automation was designed to reduce friction, preserve data integrity, and protect production throughput.
As you scroll, each mechanism below represents a structural decision made to stabilize and scale maintenance across multiple facilities.
Intake & Data Integrity Architecture
QR-Based Structured Intake & Factory Segmentation
To eliminate reporting friction and increase data consistency, a QR-based intake system was deployed directly at each printer rack across both facilities. Each QR code routed technicians to a factory-specific submission form, automatically scoping the ticket to either Redwood City (PST) or Buffalo (EST). This segmentation was not superficial; it governed downstream automation triggers, Slack channel routing, technician eligibility pools, and reporting visibility.
Rather than allowing free-form reporting, the submission interface enforced structured classification. Each ticket required a rack and bay identifier, printer model, and issue category drawn from a standardized taxonomy. This ensured every failure entered the system as a relationally linked data object instead of anecdotal text.
By embedding structured intake at the point of failure, the system established the foundation for reliable operational analytics.
Impact: Increased reporting compliance, eliminated inconsistent failure descriptions, and created clean, structured maintenance data from the source.
Validation Pipeline & Data Integrity Safeguards
To preserve long-term reliability of analytics, intake validation logic was implemented to verify rack formatting and location mapping before ticket creation finalized. If inconsistencies were detected, the system halted processing and generated a Slack notification in the appropriate maintenance channel.
This prevented corrupted records from entering the relational data model and ensured all tickets were properly linked to printer registry entries.
The system was engineered to fail loudly rather than silently, preserving trust in downstream metrics such as recurrence frequency and MTTR.
Impact: Protected dataset integrity, prevented relational mismatches, and maintained analytical reliability as the system scaled.
Automation & Workflow Orchestration
Daily Dispatch Engine & Certification-Gated Routing
To remove manual dispatch bottlenecks, a timezone-aware scheduling automation was implemented to execute at 9:00 AM local time in both facilities. Each morning, the system evaluated all open “Todo” tickets, sorted them by priority and age, and cross-referenced each issue category against technician certification records.
Eligibility gating ensured that only technicians certified for a specific repair class were considered for assignment. This eliminated skill mismatch routing and reduced multi-touch resolution loops caused by improper initial allocation.
The dispatch engine recorded assignment timestamps and automatically posted structured summaries into factory-specific Slack channels, providing full operational visibility without requiring manual oversight.
Impact: Eliminated manual routing, reduced reassignment cycles, and stabilized daily repair throughput.
Workload Balancing & Throughput Stabilization
Assignment logic extended beyond eligibility. The system evaluated workload distribution signals by comparing tickets assigned versus tickets completed, approximating technician throughput velocity. This allowed distribution of complex repairs across the team rather than concentrating high-impact failures on the same individuals.
By stabilizing workload variance, the automation reduced burnout risk and improved predictability in daily repair capacity.
Impact: Balanced technician workload, improved throughput consistency, and reduced variability in resolution timing.
Escalation Protocol & Backlog Discipline
To prevent silent backlog accumulation, a time-based escalation rule was embedded into the ticket lifecycle. Any ticket unresolved beyond 48 hours automatically received a priority elevation, ensuring aging issues resurfaced during subsequent dispatch cycles.
Disposition-triggered reassignments were treated as signals of complexity. Instead of resetting urgency, the system preserved aging context and boosted priority immediately. This accelerated resolution of difficult cases and prevented stagnation through repeated reassignment.
A nightly reconciliation process cleared ownership from incomplete tickets at the end of each operational day. This prevented “In Progress” status from masking dormant work and ensured each new day began with an accurate backlog state.
Impact: Reduced ticket aging, enforced implicit SLA discipline, and preserved queue transparency.
Certification & Capability Framework
Category-Mapped Certification Controls
Technician capability was formalized through structured certification categories mapped directly to issue types. Assignment eligibility was dynamically determined by matching ticket classification against certified competencies.
This created a self-reinforcing system: as technicians expanded certifications, the eligible labor pool increased, unassignable tickets decreased, and backlog risk diminished.
Certification approvals and revocations were logged, creating a historical record of workforce capability development.
Impact: Reduced skill mismatch, accelerated repair resolution, and aligned workforce development with operational needs.
Technician Performance & Close Rate Analytics
The system computed performance metrics at the technician level, including mean repair duration, percentage of tickets completed within system average time, and flagged outliers exceeding expected thresholds.
These metrics were not manually compiled reports but derived directly from timestamp differentials and category baselines. Weekly and cumulative views allowed managers to identify training gaps and recognize high-performing technicians through objective data rather than perception.
Impact: Enabled data-driven coaching, improved accountability, and increased repair efficiency over time.
Fleet Governance & Asset Intelligence
Serial-Number Registry & Lifecycle Tracking
Each printer was modeled as a structured asset entity with a unique serial identifier, factory designation, rack location, and model classification. Tickets were relationally linked to printer records, enabling maintenance history tracking at the unit level.
This architecture allowed the organization to identify printers with disproportionate failure frequency, detect recurring issue patterns by model, and evaluate environmental performance differences between farms.
Maintenance transformed from reactive repair to asset intelligence.
Impact: Enabled evidence-based hardware decisions, improved reliability forecasting, and reduced systemic blind spots.
Update Logging & Duplicate Prevention
Printer creation and update workflows included duplicate serial detection and structured audit logging. Every update recorded timestamps, administrative user context, and change history.
By protecting the registry against fragmentation and maintaining a transparent update trail, the system ensured long-term governance integrity.
Impact: Preserved clean asset data, prevented duplication errors, and increased administrative accountability.
Slack Integration & Operational Transparency
Ambient Workflow Communication
Slack was integrated as the system’s communication backbone to eliminate reliance on manual dashboard monitoring. Dispatch summaries, validation failures, certification updates, and printer registry changes were surfaced in real time to relevant factory channels.
By transforming maintenance from a pull-based dashboard interaction into an ambient communication flow, adoption increased and operational awareness improved across teams.
This integration reduced coordination friction and allowed leadership to monitor maintenance health without micromanagement.
Impact: Increased visibility, improved adoption, and strengthened cross-team coordination.
Performance Analytics & KPI Infrastructure
Mean Time to Repair & Duration Benchmarking
With structured timestamps embedded in every ticket, the system calculated Mean Time to Repair across issue categories, technicians, and facilities. Duration baselines allowed automatic flagging of outlier repairs, surfacing inefficiencies and process inconsistencies.
For the first time, repair speed was measurable at scale rather than anecdotal.
Impact: Quantified repair efficiency, revealed training opportunities, and supported continuous improvement.
Backlog Health & Aging Analysis
The system tracked ticket age distribution, open versus resolved ratios, and unresolved duration bands. Escalation rules reduced the aging tail of tickets exceeding 48 hours and improved queue turnover rates.
Backlog health became visible and measurable rather than assumed.
Impact: Reduced stagnation, improved SLA alignment, and increased confidence in production stability.
Recurrence & Reliability Pattern Analysis
By aggregating tickets per printer and per issue category, the system revealed recurring failure clusters and high-risk assets. This enabled proactive maintenance scheduling, targeted hardware upgrades, and informed procurement decisions.
Maintenance became a predictive input into production strategy rather than a reactive cost center.
Impact: Reduced recurring failures, improved asset longevity, and strengthened production forecasting.
Organizational Transformation
Before implementation, maintenance was reactive, undocumented, and difficult to quantify. Dispatch required manual coordination. Skill mismatches caused delays. Backlog aging went unnoticed. Hardware reliability was anecdotal.
After implementation, maintenance operated as a structured automation engine. Certification gating aligned skills with complexity. Escalation rules prevented silent stagnation. Serial-level intelligence informed hardware decisions. Multi-facility operations ran within isolated yet scalable workflows.
The system did not simply track failures.
It introduced operational discipline, workforce intelligence, asset governance, and measurable performance analytics into the production core of the company.
Maintenance shifted from reactive burden to controllable variable.
Designing a Self-Managing Maintenance Workflow
The core of the KAV Maintenance System was not ticket tracking; it was workflow automation. The objective was to eliminate manual dispatch, prevent backlog stagnation, and enforce operational discipline without adding managerial overhead.
Rather than relying on reactive coordination, the system was engineered to evaluate workload, technician capability, and ticket urgency automatically every day.
The automation layer transformed maintenance from a reactive process into a controlled operational loop:
Intake → Evaluation → Assignment → Escalation → Rebalancing → Reporting
Every automation was designed to reduce friction, preserve data integrity, and protect production throughput.
As you scroll, each mechanism below represents a structural decision made to stabilize and scale maintenance across multiple facilities.
Operational Impact & Measurable Gains
When the system was first introduced, maintenance was operating under compounding pressure. Tickets accumulated faster than they could be resolved, technicians lost significant time to coordination overhead, and recurring failures were difficult to isolate at the serial level.
By formalizing intake, embedding certification-gated routing, and introducing time-based escalation with daily redistribution, maintenance was converted from reactive troubleshooting into a controlled operational loop.
Over the course of the factory’s active lifecycle — from the first recorded ticket in July 2024 through facility wind-down in September 2025 — the system processed more than three hundred structured maintenance events. What began as backlog-heavy stabilization gradually transitioned into steady-state control.
Repair time compressed into predictable ranges. Open workload stabilized into low single digits. Repeat-failure printers saw longer intervals between incidents. Managerial dispatch overhead became exception-based rather than daily labor.
The data reflects not just higher resolution volume, but a systemic compression of maintenance volatility; reduced backlog pressure, faster repair cycles, and measurable extension of asset stability.
Enhanced Operational Visibility Delivered Tangible Performance Gains
Overall Resolution Rate
Repairs Completed Within One Hour
Median Reduction in Incident Rate Per Printer
Increase in Median Time Between Repeat Incidents
Reduction in Average Concurrent Open Tickets
Reduction in Daily Maintenance Time Overhead
Metrics calculated from first recorded ticket (7/03/2024) through factory wind-down (9/25/2025).

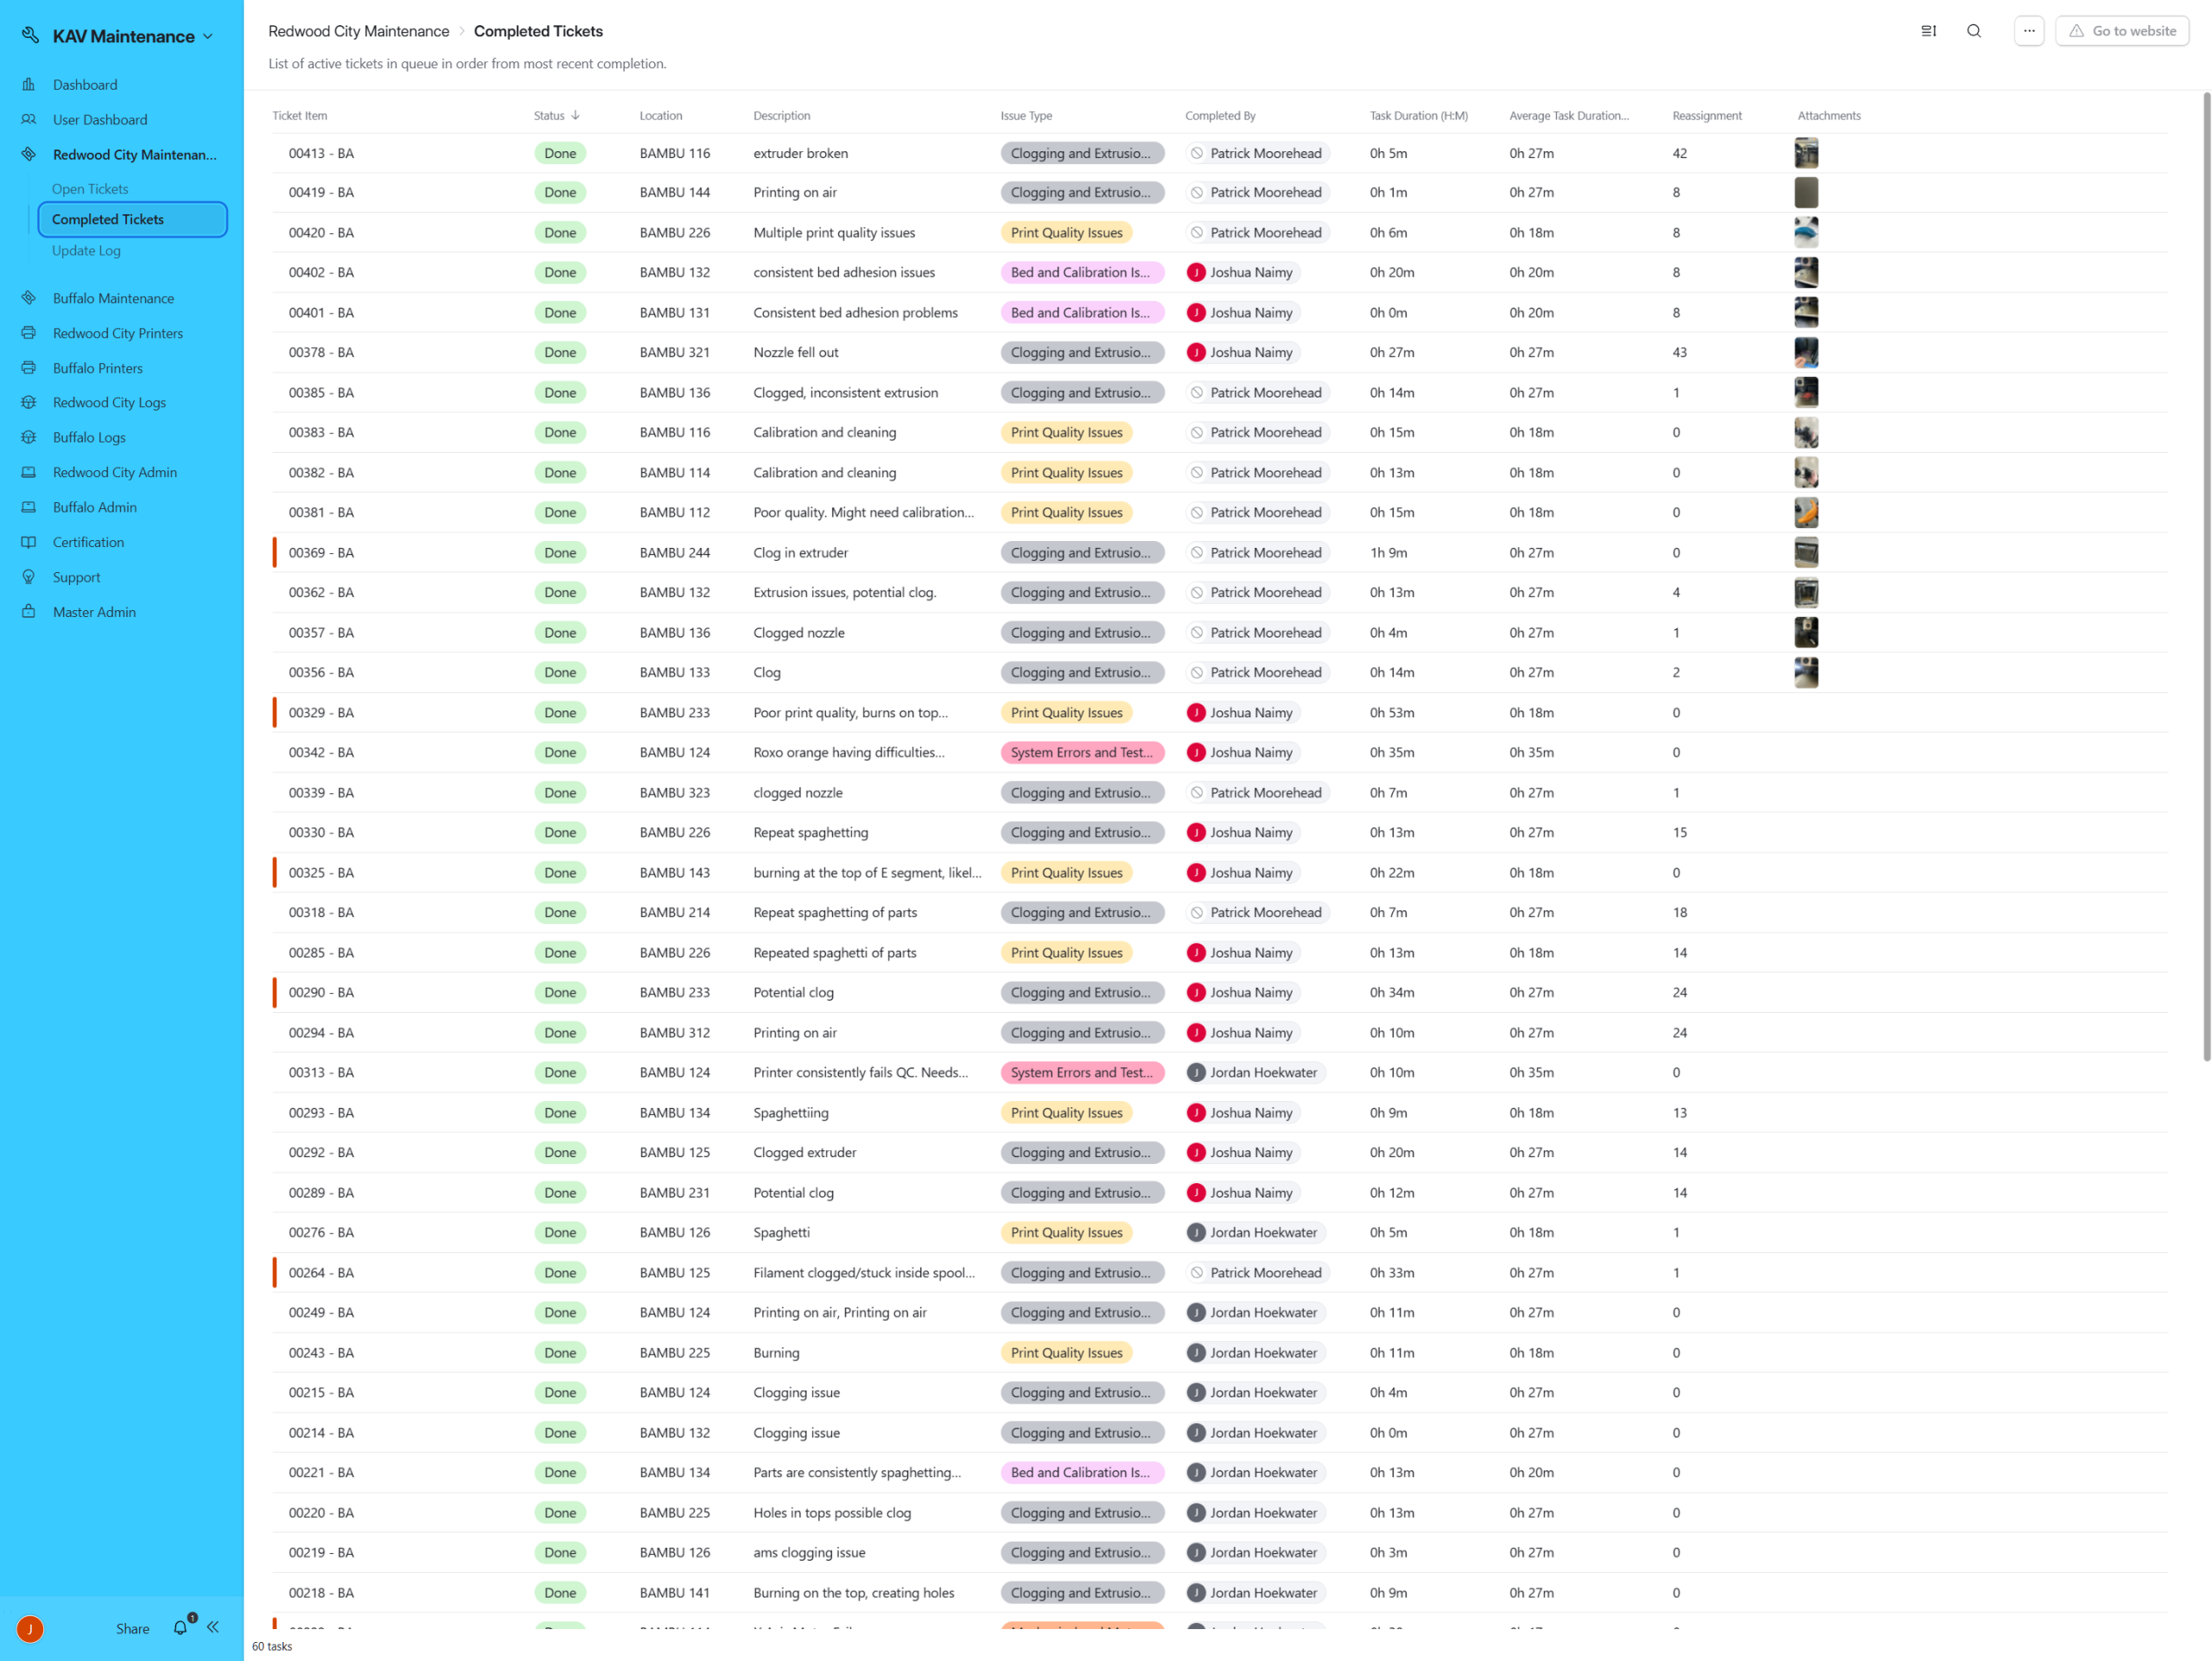
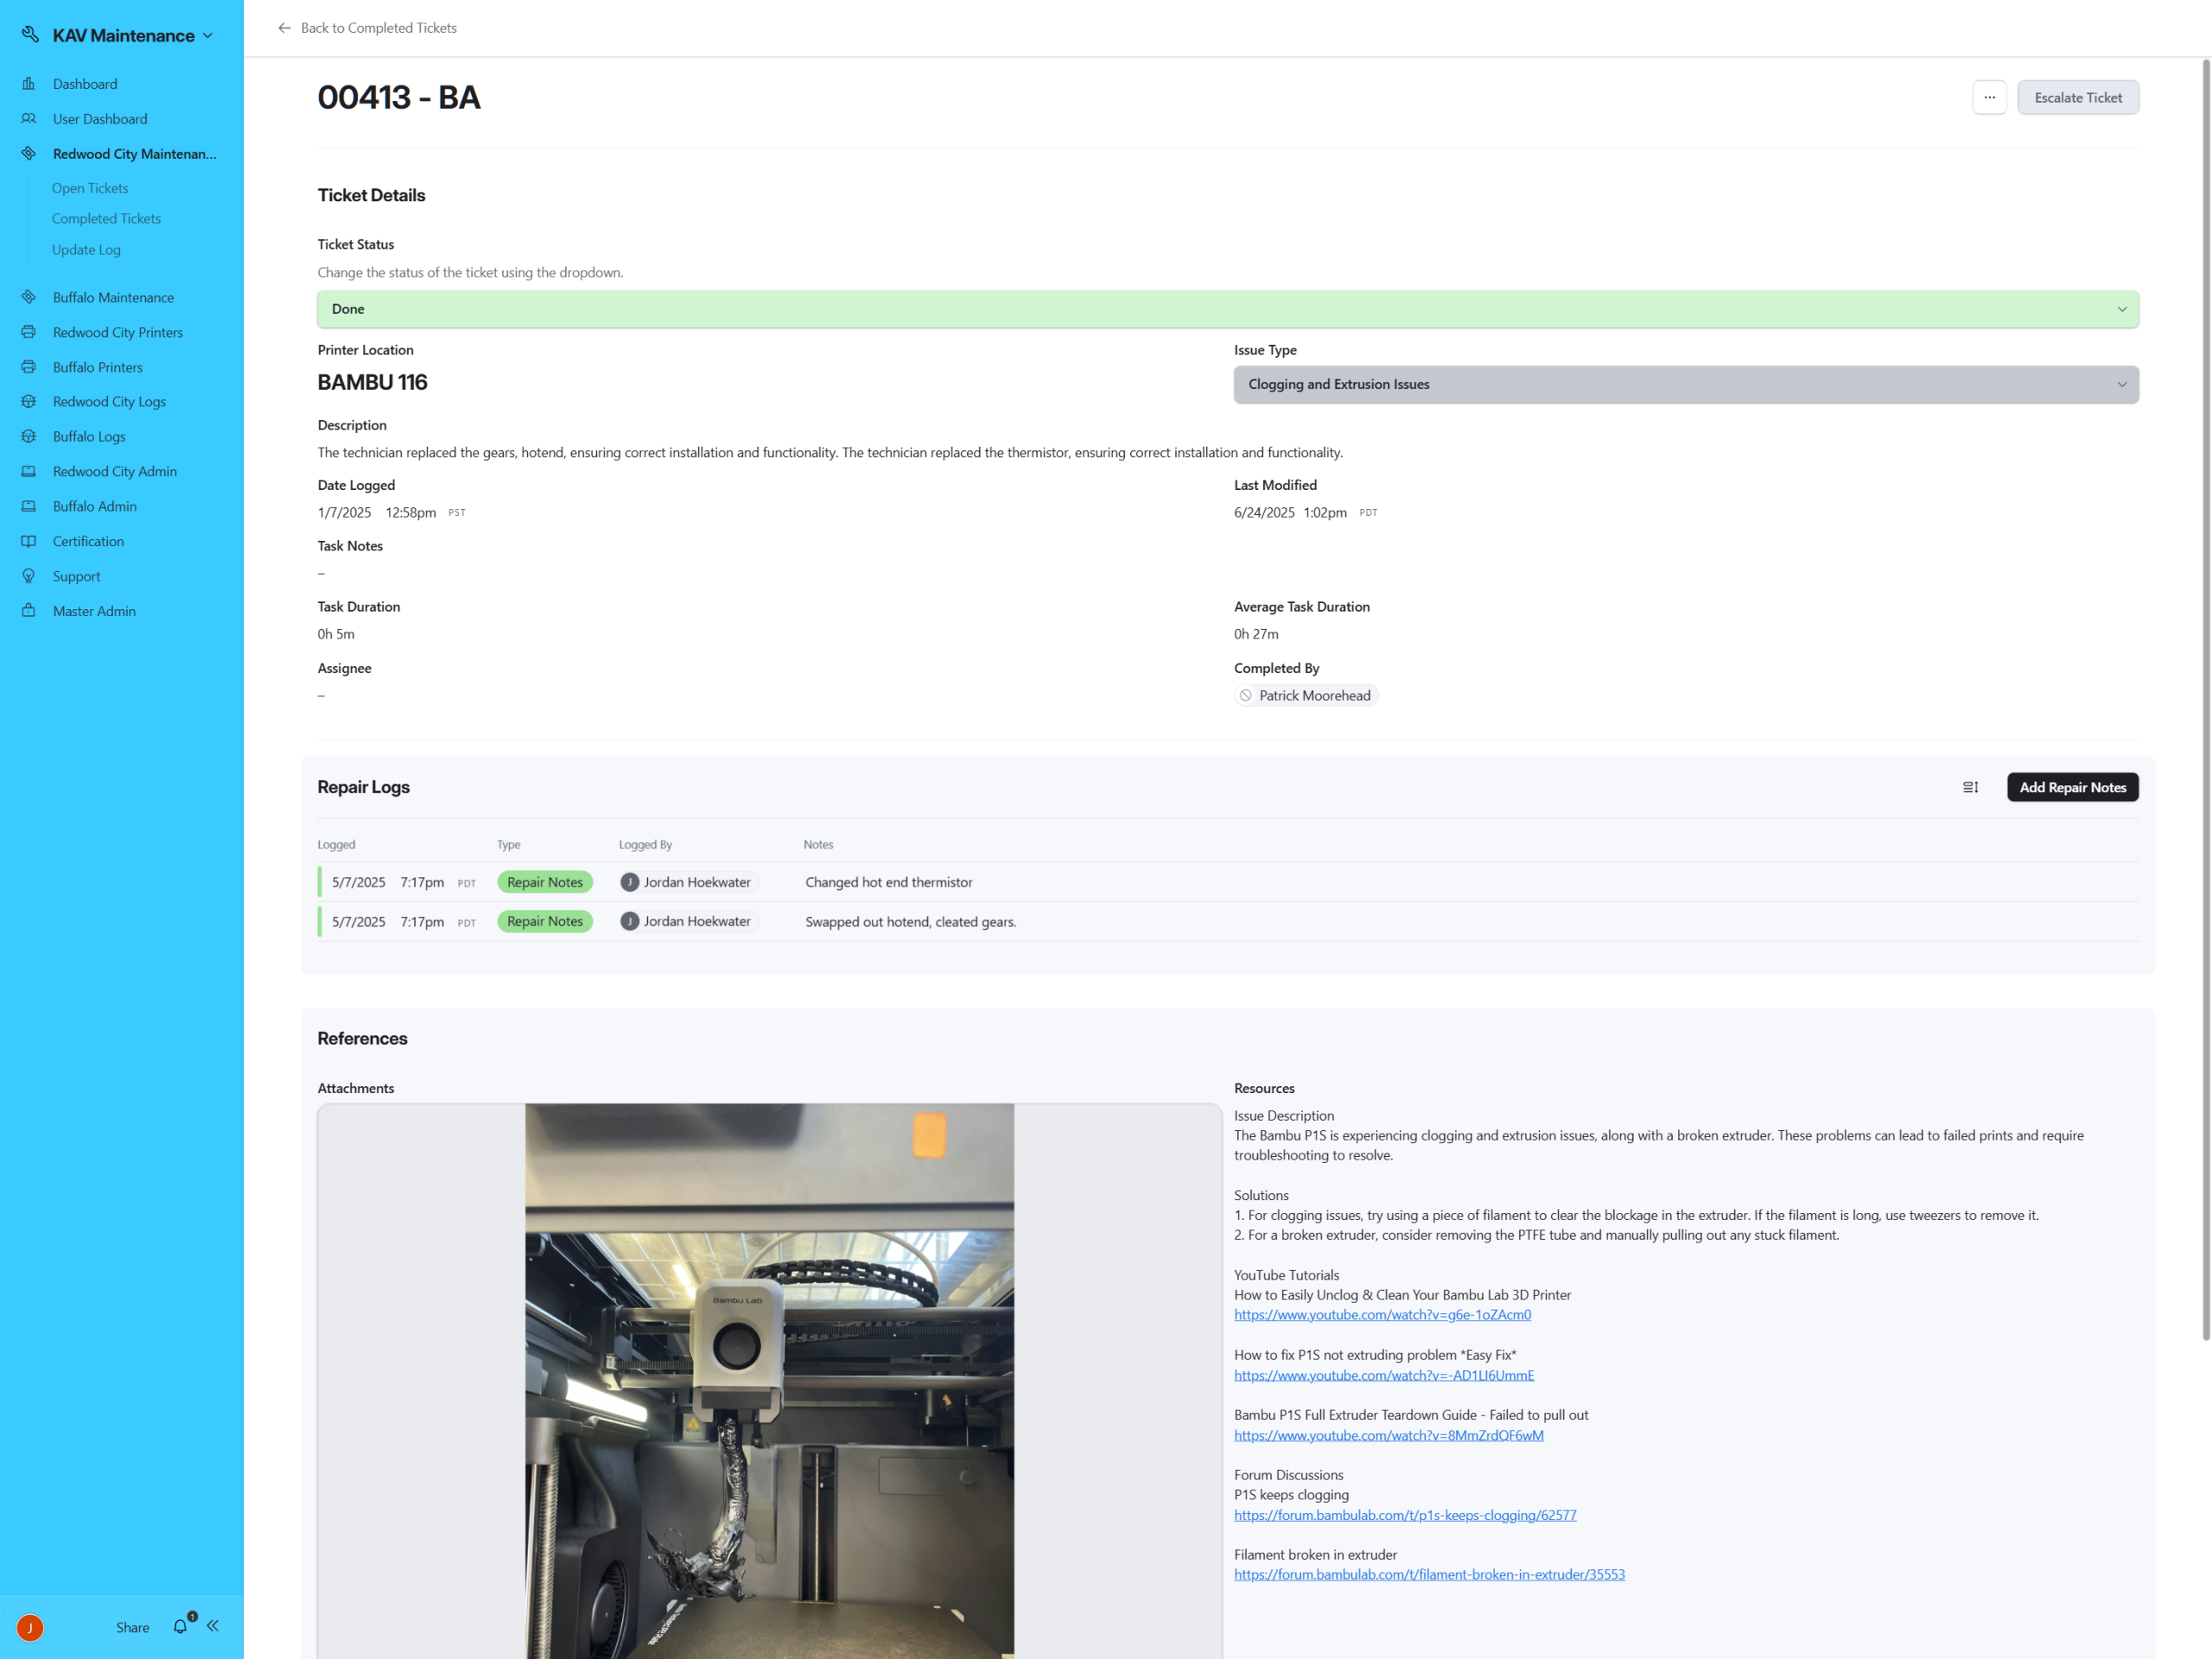
The Operational Backbone: Ticket Intelligence Layer
While the interface provided visibility, the ticket table functioned as the system’s operational backbone.
Each record represented more than a maintenance event; it encapsulated serial linkage, task categorization, technician assignment, certification validation, expected duration thresholds, and lifecycle status tracking within a single relational structure.
Tickets were directly connected to printer serials, enabling recurrence analysis and performance measurement at the asset level. Task categories standardized issue classification, eliminating ambiguous reporting. Expected durations created accountability benchmarks, while completion timestamps enabled precise throughput analytics.
Certification-based assignment logic ensured technicians only received work aligned with approved competencies. Escalation automation monitored stagnation and redistributed stalled tickets without requiring managerial intervention.
What appears as a grid of records is, in practice, a governed workflow engine; enforcing structure, surfacing risk, and maintaining operational discipline at scale.
Conclusion & Reflection
This project began as a response to operational instability. What emerged was a structured production system capable of governing maintenance behavior at scale.
By combining relational architecture, automation logic, certification-based routing, and performance analytics, the system transformed maintenance from reactive troubleshooting into a measurable operational function. Backlog pressure stabilized, repair time compressed into predictable ranges, and repeat-failure assets were surfaced through data rather than anecdote.
More importantly, this project reinforced a core principle of scalable operations: visibility alone does not create performance. Structure does.
The most impactful gains were not achieved through dashboards, but through workflow enforcement; clearly defined states, automated redistribution, eligibility gating, and serial-level traceability. When structure and data integrity are embedded into daily execution, performance becomes a byproduct rather than an objective.
If extended further, this system could scale across multiple facilities, support predictive maintenance modeling, integrate supply-chain forecasting for replacement parts, and surface early-warning reliability signals through machine-level trend analysis.
What began as a maintenance tracker evolved into an operational control framework; one capable of converting production volatility into structured, measurable throughput.